
Summary
My answer: specification, architecture, and verification — the judgment calls, not the typing. I built a framework to test this properly (not just vibes), then checked it against real data: GitHub’s 2025 growth numbers and two years of GitClear’s code quality metrics.
What I found — code output is exploding, but duplication, refactoring, and rework are all moving in the wrong direction at the same time. That’s the theory holding up. What it doesn’t tell us yet is whether that gap closes the way past automation waves eventually closed theirs, or not. Read on…
Skip to the end if you just want the 5 metrics to check this against your own team’s data.
Background and history
- What is required to build quality software = Specifications + Code + Verification
- Specifications = Features + Design
- Code = Architecture + Lines of Code
- Verification = Confirming requirements coverage
- Quality software = f(accuracy, timeliness, completeness)
- accuracy = always works as expected
- timeliness = arrives on time without exponetial increase in cost
- completeness = meets all requirements specifications
Lets trace the journey to automate quality software build since 1948 – first time software (Manchester Baby) was stored electronically in memory and executed by a computer, so the model of “software” we still use today — a program as data, not hardwiring
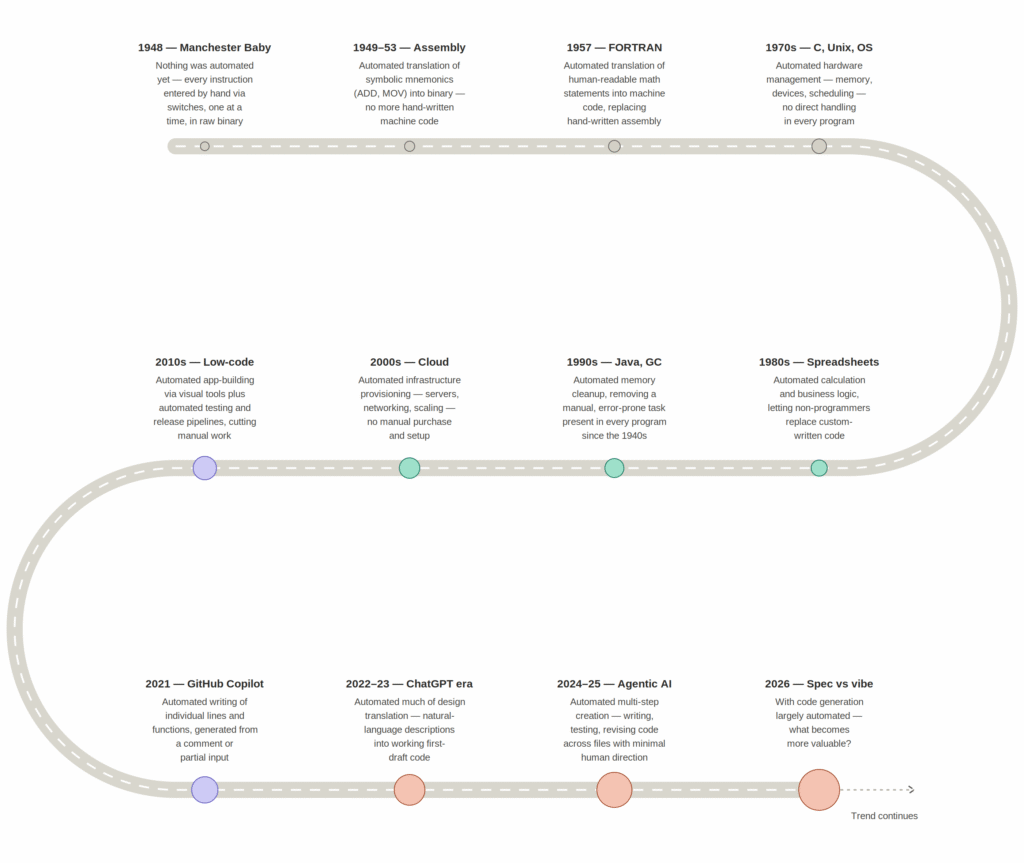
Across 78+ years, every wave of automation absorbed execution — instructions, syntax, memory, infrastructure — while other tasks in the value chain kept getting more valuable, because something harder was always left to be automated.
The last few years broke that pattern: automation jumped from individual tasks to entire multi-step development work, putting direct pressure on the tasks higher up in the value chain. But do we know if the historical pattern of the gap closing will hold?
Theory – 2 axis framework
To understand what will become valuable lets first look at the below 2 axis framework
This framework builds on task-based automation economics — the work of David Autor, James Bessen, and Erik Brynjolfsson — synthesized here into a testable form for software
Axis 1 – Completeness of task replacement
Partial replacement
- When a technology automates one task within a larger bundle, the whole bundle gets cheaper to access
- This typically increases total demand for the bundle, because most demand curves are more elastic than they first appear
- So the remaining, non-automated tasks become more valuable — not because they change, but because they’re now the bottleneck standing between cheap inputs and a finished, quality result
- Example: In US, ATMs cut tellers per urban branch from 20 to 13 (1988–2004), but branches became cheaper to run so urban branch count grew 43% (Jevons paradox) — per economist James Bessen’s research (Learning by Doing, 2015)
Near total replacement
- When a technology automates nearly the entire task bundle, there’s nothing left to do
- But complete replacement diffuses slowly — technologies capable of full replacement have historically taken decades to be adopted
- Example: Continuing on above example, ~2010 mobile banking reduced the need of branch visits (per BLS occupational data) rather than just automating one task within them
Axis 2 – Value chain
- What is being encoded by automation in the value chain of a bundle production?
- When automation encodes expert knowledge, the tool effectively hands tacit knowledge of the experts to everyone
- When automation encodes the routine output required to produce larger bundle then expert knowledge that tool cannot replicate becomes the bottleneck
- The distributional outcome of any automation wave depends entirely on where in the value chain the automated task sits
The Theory
- Layering the 2 axes together we make a testable theory – The tasks that become more valuable are the ones that satisfy three conditions simultaneously:
- Axis 1 – They are not automated or partially automated
- Axis 2 – They sit at the top of the value chain where judgement rather than routine execution determines the results
- They are the actual bottleneck on the quality of the final output – accuracy, timeliness, completeness – not just its speed of execution (!)
- Apply this to building software specifically, it gives the following durable categories of value:
- Specification
- Defining precisely what should be built, in a form precise enough for an automated system to execute against correctly
- This is the task that determines whether automated output is even aimed at the right target
- Architectural and systems-level judgement
- deciding how new work fits into an existing, evolving whole. eg: what should be reused rather than reinvented, what belongs where, and what the long-term cost of a shortcut will be
- This task most directly threatened by automation tools that optimize for shipping fast, isolated, working units rather than coherent systems
- Verification and judgement
- Checking that automated output is correct, secure, and fit for purpose
- This task doesn’t disappear when coding gets cheaper; it will become more demanding, because there’s more output to check and the errors are subtler e.g.: functionally correct but architecturally wrong, syntactically clean but insecure, locally fine but duplicative at the system level
- Specification
Testing The theory
Claim 1 — Automation scope jumped sharply, not gradually
| Metric | Data | Observation |
|---|---|---|
| New repositories created (2025) | 121 million or ~230 new repos/minute | Total software-building volume is exploding, not shrinking, as automation makes coding cheaper — the Jevons-paradox signature |
| New developers joined (2025) | 36 million | Pool of people writing software is expanding alongside automation, not contracting |
Source: GitHub Octoverse 2025 report — octoverse.github.com, covering September 2024–August 2025
The volume and pace of software-building activity took a step-change in the last few years, not a gradual ramp. This is a materially different scale of automation than any prior era in the timeline
Claim 2 – This is stressing and making more valuable architecture, verification and judgement
| Year | Duplicated code share | Refactored code share | Two-week churn |
|---|---|---|---|
| 2020 | 8% | 24% | 3.1% |
| 2022 | 9%* | 22%* | 4.5%* |
| 2024 | 12% | 10% | 5.7% |
| 2026 | 16% | 7% | 6.5%* |
Source: GitClear — gitclear.com/the_ai_code_quality_maintainability_gap
(*) Values marked with an asterisk are directional estimates, not exact published figures for that specific year
3 independent metrics, not one, move the same direction. Rising duplication and falling refactoring show architectural reuse and integration judgement declining as a share of total work. Rising churn adds a second dimension: more of what’s produced is wrong or incomplete on first pass and has to be redone.
Together they say the strain is landing specifically on the layer The theory calls out — specification, verification, architecture — not on raw code output, which is simultaneously exploding per Claim 1
So what?
The data — not just the historical analogy — supports the theory: that this software build automation wave is large and fast, it is specifically making valueable specification, architecture, verification layer
Test This on Your Own Team: 5 Metrics to Track
1. Duplication and refactor ratio in your own repo
- How to measure: run GitClear (or a simple git-diff script) on your last 6-12 months of commits
- Framework holds if: duplication is rising and refactoring is falling as AI-assisted commits increase
- Framework fails if: the ratio stays flat or improves alongside AI adoption
2. Two-week churn rate
- How to measure: % of merged code that gets meaningfully rewritten or reverted within 14 days — pull from git history, commits touching the same lines shortly after merge
- Framework holds if: churn rises with AI-assisted code share
- Framework fails if: churn stays flat, meaning first-pass output is holding up fine without extra correction
3. Time-to-merge and review depth on PRs
- How to measure: compare average review time and comment count on AI-assisted vs. non-AI-assisted PRs — most orgs can tag this today
- Framework holds if: AI-assisted PRs need equal or more review time/comments, not less
- Framework fails if: AI-assisted PRs merge faster with less review and no rise in post-merge defects
4. Post-merge defect/incident rate by commit origin
- How to measure: tag commits as AI-assisted vs. not, compare bug/incident rates tied to each over the next few release cycles
- Framework holds if: AI-assisted code shows a higher defect rate unless it went through deliberate review
- Framework fails if: defect rates are the same regardless of review depth
5. Where your engineers’ hours actually go — writing vs. reviewing vs. architecting vs. debugging
- How to measure: tag time (self-report, or pull from calendar/ticket data) for a representative sample of your team, split junior vs. senior
- What the framework predicts: the split should shift away from first-draft writing and toward review, specification, and architecture — most visibly for senior engineers, since they’re the ones absorbing the judgment work AI can’t do alone
- Framework holds if: writing time shrinks as a share of the week while review/architecture time grows, especially among seniors
- Framework fails if: the time split is unchanged despite heavy AI adoption — meaning either AI isn’t actually shifting the nature of the work, or teams are absorbing more output without doing the review the framework says is necessary (worth flagging as its own risk, not just a null result)
Then what?
Next should I attempt to answer these branched questions or others?
- What is impacting quality of Agentic coding?
- What is the level of automation achieved in specifications, architecture, verification with Agentic tools?